
DRIVE
by CONVERGE · Leadership & Strategic Insights
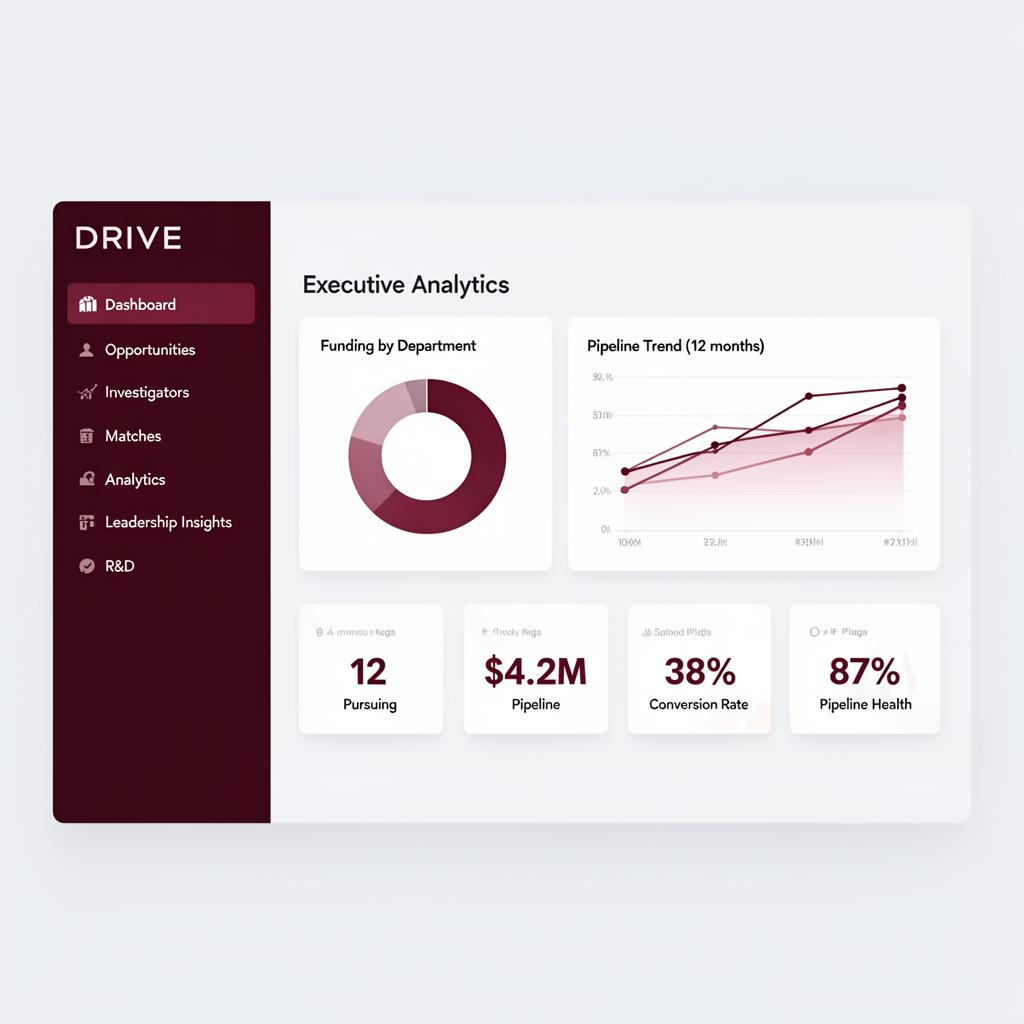
Strategic Intelligence for Institutional Leadership
DRIVE gives VPRs, deans, and associate provosts executive-level visibility into the research funding landscape — portfolio analytics, capacity gaps, conversion metrics, and strategic recommendations.
While FAIRWAY serves researchers and SIGNAL powers RD teams, DRIVE is built for institutional leaders who need the big picture to drive strategic investment.
What Makes DRIVE Different
DRIVE aggregates data from the entire CONVERGE ecosystem — FAIRWAY activity, SIGNAL pipeline data, and institutional records — into strategic insights.
Cross-System Intelligence
DRIVE pulls from every module. See how faculty interactions in FAIRWAY translate to pipeline activity in SIGNAL and ultimately to funded awards.
Strategic Recommendations
Not just dashboards — DRIVE identifies where you're over-indexed, where you have untapped capacity, and where to invest next.
Board-Ready Reporting
Export polished analytics for provosts, deans, and boards of trustees. No spreadsheet assembly required.
Sample Strategic Insights
Engineering Dept.
↑ 12% vs. last year
Life Sciences
23 active pursuits
Expertise Gap
High demand, low capacity
Untapped
Faculty match, no pursuits
From Data to Strategy
DRIVE transforms raw pipeline activity into actionable intelligence. See which departments are converting, where expertise gaps exist relative to funding trends, and where untapped opportunities sit waiting.
Strategic Intelligence Capabilities
Portfolio Analytics
Visualize funded research by sponsor, department, dollar volume, and success rates.
Department Benchmarks
Compare pipeline activity and conversion rates across departments.
Trend Analysis
Track funding shifts — emerging sponsors, growing categories, declining areas.
Pipeline Visibility
Real-time view of all opportunities, matches, and pursuits institution-wide.
Expertise Mapping
Understand depth and gaps relative to available funding.
Strategic Recommendations
Data-driven suggestions for capacity building and partnership development.
See Drive in Action
Schedule a personalized demo to see how Drive can work for your institution.